Someone Tried to Break Into My Server. The EDR I Wrote Caught It.
Someone Tried to Break Into My Server. The EDR I Wrote Caught It.
Any SSH port exposed to the internet ends up in somebody’s wordlist eventually. Mine did.
This post walks through how Sentora Community Edition, the self-hosted EDR/SIEM/SOAR platform I build, saw the attempt, classified it, and cut the source off.
It is not a product pitch. The screenshots are from a live box, the timestamps are real, and I have included the parts where the platform did not do the impressive thing. That is usually the more useful half of an EDR writeup anyway.
1. The environment
| Component | Value |
|---|---|
| Host | ip-***** (AWS, Linux) |
| Agent | Sentora agent, connected over the TCP ingest channel |
| Monitored source | /var/log/auth.log |
| Detection layers | conf/rules.yaml patterns, on-endpoint Sigma, correlation engine |
| AI triage | Local Ollama (llama3.2:3b) |
| Response | SOAR playbook engine, BLOCK_IP action |
The model running locally is a design decision rather than a preference. Piping your own auth.log into a SaaS and calling it AI-powered security hands a third party exactly the dataset an attacker would want. There is no OpenAI key here, no Anthropic key, and no phone-home.
2. Anatomy of the attempt
The Alerts tab shows 25 alerts in the 24 hour window: 2 CRITICAL, 8 HIGH, 15 MEDIUM.
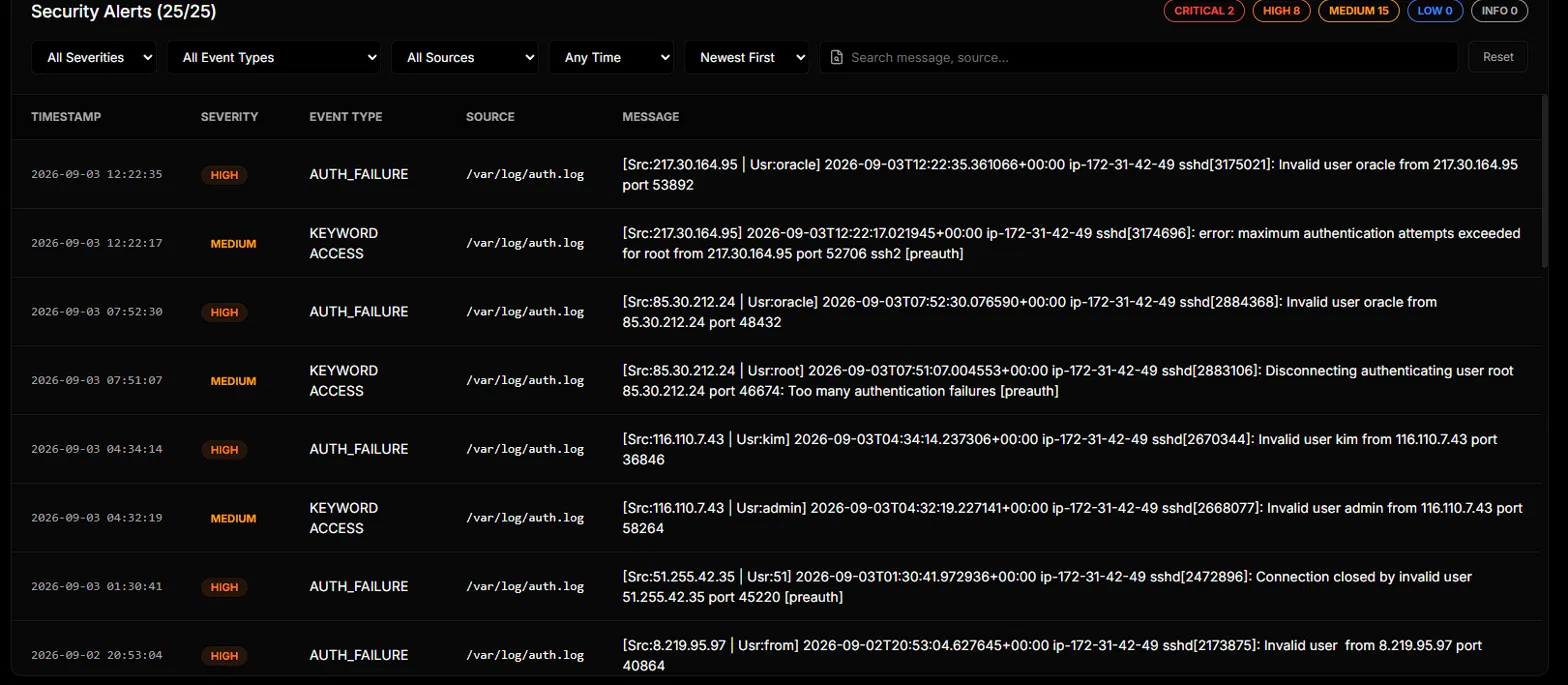 The alert list. Source IP and attempted username are already parsed out of each line.
Flattened into a table, the raw events look like this:
| Time (UTC) | Source IP | Username tried | Event |
|---|---|---|---|
| 2026-09-02 20:53:04 | 8.219.95.97 |
(empty) | Invalid user |
| 2026-09-03 01:30:41 | 51.255.42.35 |
51 |
Connection closed by invalid user |
| 2026-09-03 04:32:19 | 116.110.7.43 |
admin |
Invalid user |
| 2026-09-03 04:34:14 | 116.110.7.43 |
kim |
Invalid user |
| 2026-09-03 07:51:07 | 85.30.212.24 |
root |
Too many authentication failures |
| 2026-09-03 07:52:30 | 85.30.212.24 |
oracle |
Invalid user |
| 2026-09-03 12:22:17 | 217.30.164.95 |
root |
Maximum authentication attempts exceeded |
| 2026-09-03 12:22:35 | 217.30.164.95 |
oracle |
Invalid user |
Five distinct sources, one behaviour. admin, oracle, root, kim are page one of every standard SSH wordlist. No human is sitting there typing. Something scanned a range, found port 22 open, and started working through a list.
217.30.164.95 stands out from the rest. Inside 18 seconds it hit the maximum authentication limit on root and then moved on to oracle. That is fast and it is targeted, not just background noise.
In ATT&CK terms this sits between T1110.001 (Password Guessing) and T1110.003 (Password Spraying).
3. Layer one: raw lines become named fields
The agent does not just grep auth.log. It parses each line into fields, which is where the [Src:217.30.164.95 | Usr:oracle] prefix on the screen comes from. This matters more than it looks, and section 4 explains why. You cannot correlate what you never counted.
Classification comes from pattern sets in conf/rules.yaml. The AUTH_FAILURE category alone carries more than thirty:
AUTH_FAILURE:
  severity: HIGH
  weight: 3
  patterns: |
    failed password
    invalid user
    illegal user
    maximum authentication attempts exceeded
    too many authentication failures
    pam_unix\(sshd:auth\): authentication failure
    ...
Alongside that, 37 Sigma rules run on the endpoint itself, covering 38 ATT&CK techniques. Sigma differs from a regex sweep because it matches named fields instead of text. A rule like Image|endswith: '\vssadmin.exe' will not fire because the word “vssadmin” showed up inside an unrelated message, and CommandLine|utf16le|base64offset|contains can read inside a base64 -EncodedCommand payload, where the plaintext command line only shows the wrapper.
The important property of this layer is that it is deterministic. If Ollama crashes, if the model returns garbage, if the box runs out of RAM, this layer keeps detecting.
4. Layer two: correlation, or what a single event cannot tell you
One failed login is routine. Five different accounts failing from one source inside forty seconds is a password spray, and you will never see that by looking at any one of those five events.
That gap is the entire reason core/correlation.py exists. The two rules that apply here:
CorrelationRule(
    name="password_spray",
    severity="HIGH",
    techniques=("T1110.003",),
    window_s=300,          # short on purpose: a spray moves fast to stay
    threshold=5,           # under per-account lockout
    group_by=lambda e: _get(e, "IpAddress", "SourceIp", ...),
    distinct_by=lambda e: _get(e, "TargetUserName", "User").lower(),
)

CorrelationRule(
    name="brute_force",
    severity="HIGH",
    techniques=("T1110.001",),
    window_s=300,
    threshold=10,
    group_by=lambda e: _get(e, "TargetUserName", "User").lower(),
    distinct_by=None,      # attempts, not accounts
)
distinct_by is what separates a spray from a brute force. Many accounts from one source, versus many attempts against one account. Count the wrong one and each attack turns into the other.
Three properties in that engine are load-bearing, and all three came out of operational pain:
It fires once per window. A condition that stays true will keep producing work until something says “already told you”. This project learned that the hard way when the defensive sweep queued 4,919 duplicate alerts.
Memory is bounded. Group keys here are attacker-supplied usernames and source addresses. An unbounded counter on those is a memory exhaustion primitive rather than a detection.
There are two vantage points. The engine on the agent sees an attack against one machine in full, but it is per host, so one account sprayed once across fifty machines is invisible to every one of them. A second engine in the ingest path counts distinct hosts and catches exactly that shape. The wide, shallow spray is the more competent attack, because it stays under both the per-account lockout and the per-host threshold.
Combined with Sigma, that is 42 techniques covered.
5. Layer three: local LLM triage
The AI Analysis tab produced 20 insights: 1 critical, 4 advisories, and 0 automatic actions.
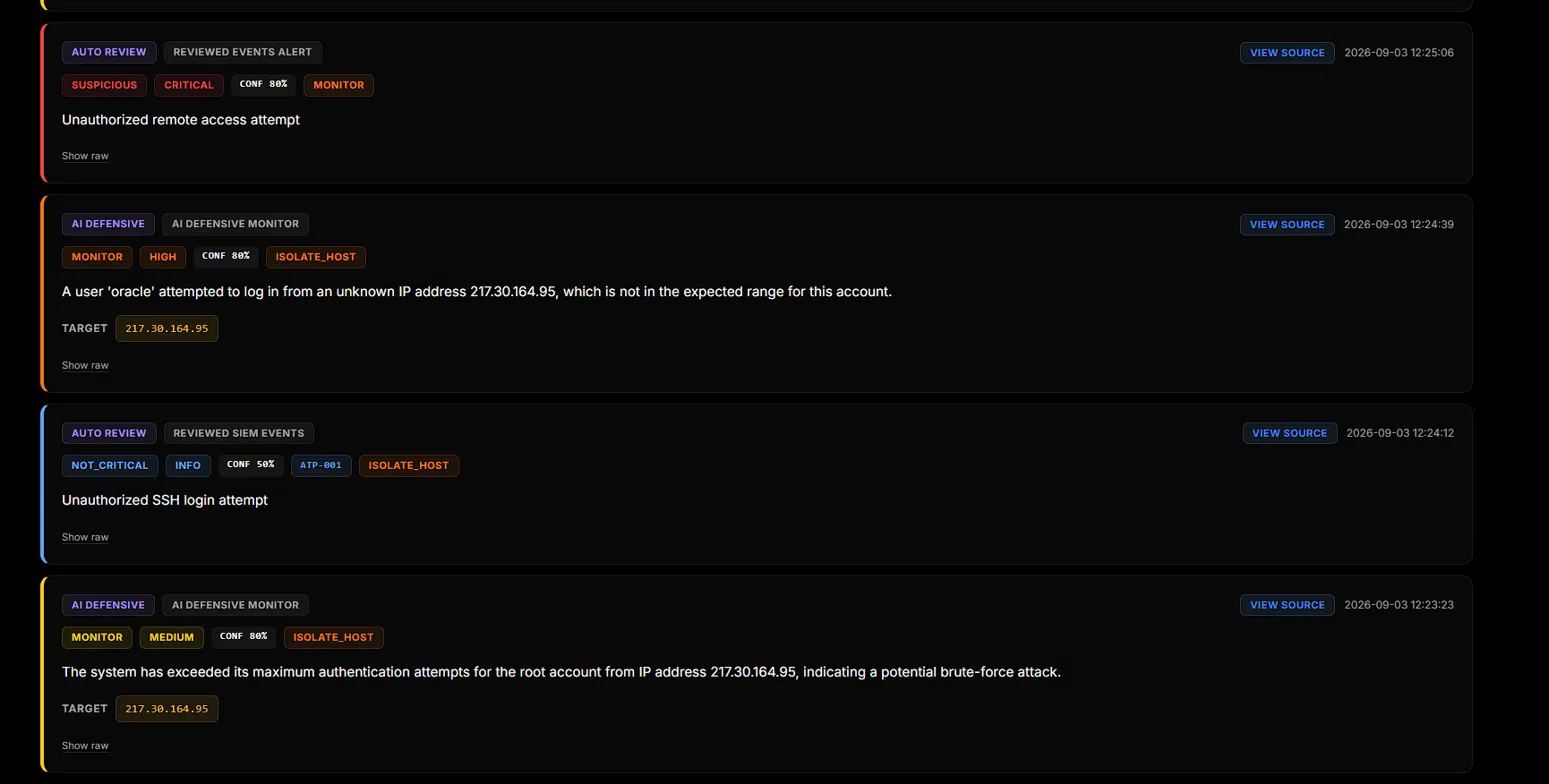 The AI Analysis overview. The banner at the top counts the events the model could not answer on instead of hiding them.
That banner deserves a moment:
2 events the model could not answer on. It contradicted itself, returned nothing usable, or the event could not be decrypted. Not findings about this host.
Most tools will not show you this. When the model produces nonsense they either swallow it silently or file it as clean. Both are lies. A 3B parameter model will sometimes return JSON that contradicts itself, and the correct handling is to count it separately as a non-finding. Silence on a console only means something once you know what was actually measured.
Now the events themselves:
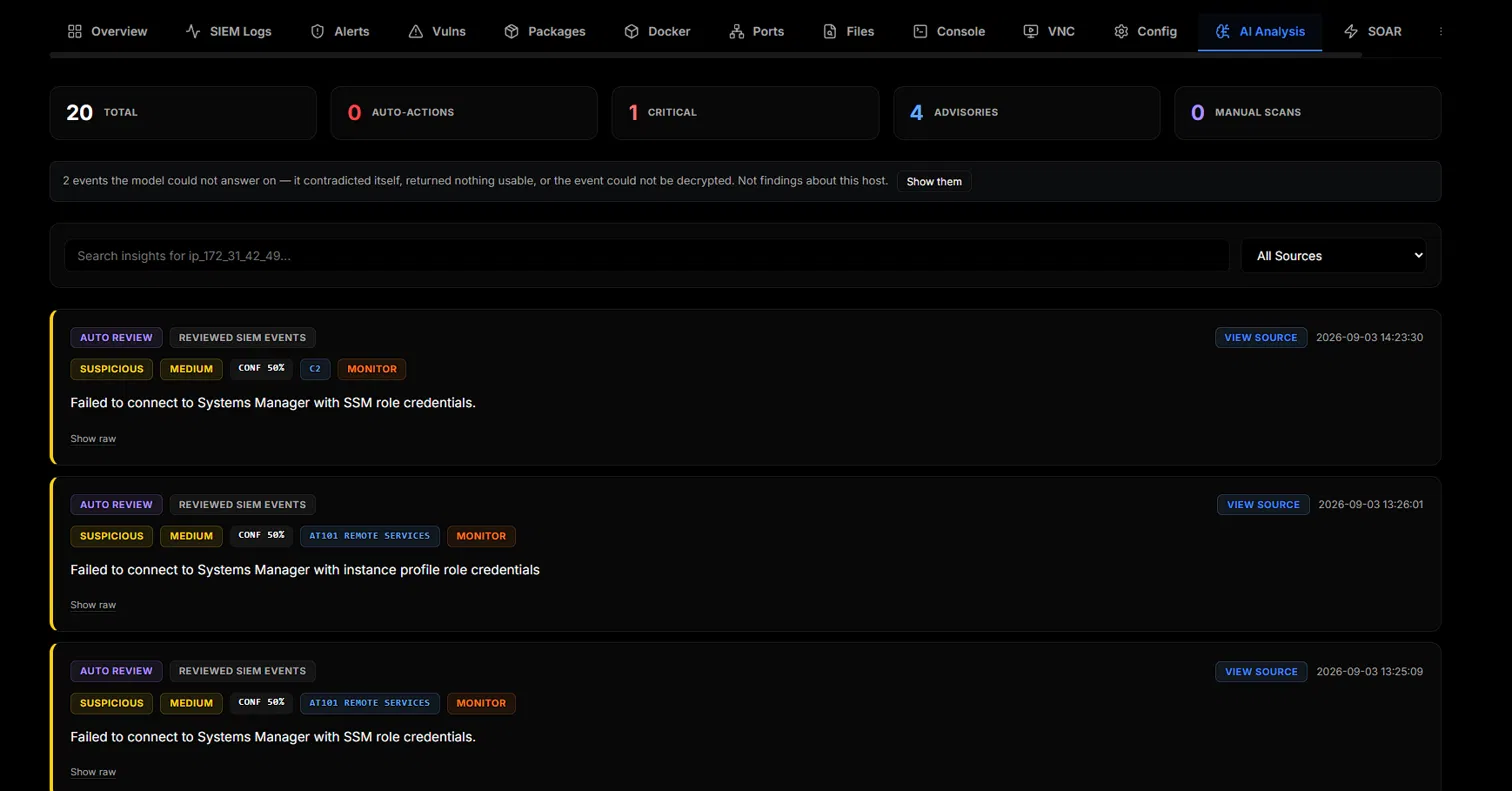 Output from the defensive worker. The attacker IP has been extracted into the TARGET field automatically.
| Time | Source | Verdict | Severity | Conf | Recommended action | Summary |
|---|---|---|---|---|---|---|
| 12:23:23 | AI DEFENSIVE | MONITOR | MEDIUM | 80% | ISOLATE_HOST |
Max auth attempts exceeded for root, potential brute-force |
| 12:24:12 | AUTO REVIEW | NOT_CRITICAL | INFO | 50% | ISOLATE_HOST |
Unauthorized SSH login attempt |
| 12:24:39 | AI DEFENSIVE | MONITOR | HIGH | 80% | ISOLATE_HOST |
User oracle logged in from an IP outside the expected range for that account |
| 12:25:06 | AUTO REVIEW | SUSPICIOUS | CRITICAL | 80% | MONITOR |
Unauthorized remote access attempt |
The model read the situation correctly. It extracted the target (217.30.164.95), named the root attempts as brute force, and flagged the oracle login as coming from an address outside the expected range for that account.
Every one of those rows is a recommendation. Section 7 covers what happened to them.
Why confidence is not a threshold
Whether an insight reaches an analyst is decided in ai/gating.py, and it asks exactly one question: does the log contain the evidence?
Model confidence is deliberately not consulted, and that came from measurement. Six CRITICAL verdicts (an LSASS dump, a SAM hive export, shadow copies being deleted) all arrived at 0.50 confidence. So did every benign case. Moving the threshold anywhere between 0.60 and 0.90 changes nothing, because the model emits 0.50 or 0.90 and almost nothing in between.
Worse, both false alarms that ever reached an analyst got there on confidence alone. The platform restarting its own Docker containers was labelled SUSPICIOUS / CRITICAL / 0.80.
So the gate now requires severity CRITICAL or HIGH plus a criterion that was checked against the log and found to be supported. The middle of the scale should come from layers you can verify, not from asking a 3B model to feel uncertain.
6. Layer four: SOAR and BLOCK_IP
Then the address was cut off.
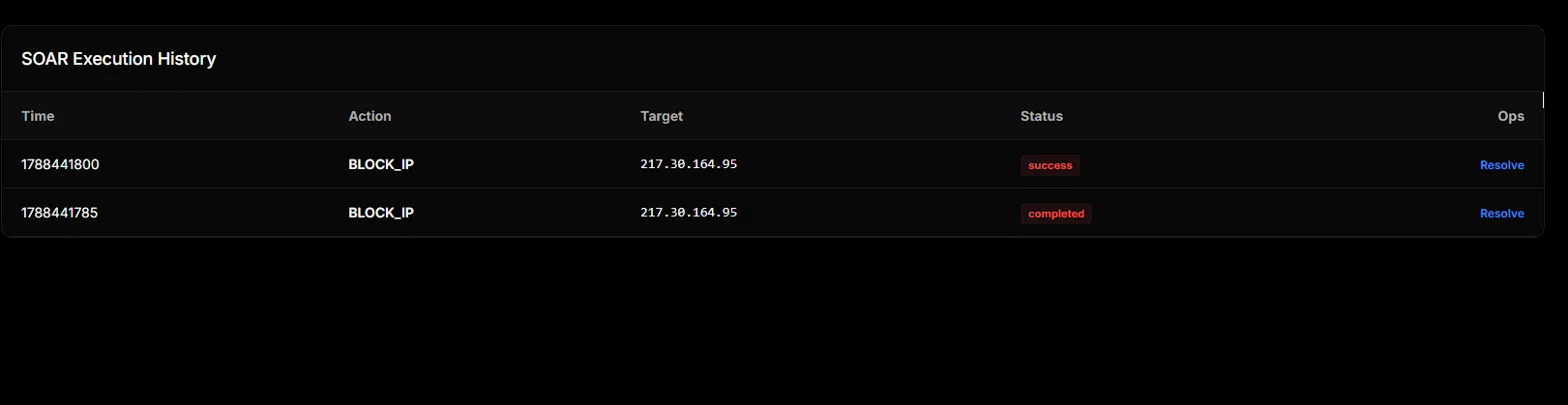 SOAR execution history. Epoch
 1788441785 is 2026-09-03 13:23:05 UTC, 1788441800 is 13:23:20 UTC.
What runs on the agent (Sentora/modules/soar/soar.py):
if self.system == 'linux':
    if self._check_iptables_exists():
        cmd = ['iptables', '-I', 'INPUT', '-s', ip, '-j', 'DROP']
The details around that line are the part that matters.
The IP is validated first (_is_valid_ip). Passing an unvalidated string to iptables as root turns your EDR into a command injection surface.
The action is idempotent. If a block is already active the call returns Already blocked (skipped) instead of writing the same DROP rule into the INPUT chain a hundred times.
Blocks expire. The default block_ttl is 3600 seconds. A permanent block is a permanent mistake, since today’s attacker address can be tomorrow’s customer behind CGNAT. When the TTL runs out the rule comes off, and the Resolve button in that table runs unblock_ip by hand.
Everything is recorded. Each action is stored with its target, timestamp and status (success, failed, resolved). A response you cannot audit is not a response.
How the server reaches the agent is its own decision: it does not. The agent opens a WebSocket to the server and every server-to-agent request rides that one connection, so there is no service on the endpoint to scan, connect to, or authenticate against. The previous design had the agent running a management API on 0.0.0.0:9099 as SYSTEM or root, with a permissive branch that accepted any non-empty X-Agent-Key whenever AGENT_MASTER_SECRET was unset. Nothing in the repo ever set it, so every default install ran that way. An EDR that fails open is worse than no EDR, because the console reports the endpoint as protected.
7. The honest part: what the model recommended, and what actually ran
Look at the recommended action column in section 5 again. Every defensive insight the model produced about this attack asked for ISOLATE_HOST.
Not one of them ran.
The reason is this condition in ai_worker.py:
should_act = (
    v == 'ACT'
    and conf >= CRITICAL_CONFIDENCE_THRESHOLD
    and action in AUTONOMOUS_ACTIONS
    and target and target != 'none'
)
The verdict was MONITOR, not ACT. Confidence was 80%, the recommended action was on the safe list, and the target was valid, but none of that gets evaluated because the first clause already failed. The rows were filed as AI_DEFENSIVE_MONITOR and the recommendation stayed a recommendation. That is what the 0 AUTO-ACTIONS counter is reporting: the number of times the model’s own autonomous path pulled a trigger, which was zero.
The response that did run is the one in section 6. BLOCK_IP against 217.30.164.95, source dropped, host up and reachable the whole time.
The distance between those two is the entire point of this section. The model found the right event, named the technique correctly, extracted the right target, and then proposed a response out of proportion to it. ISOLATE_HOST here would have taken a working production host out of service over an attack that never got past the login prompt: doing to myself what the attacker could not manage. The answer to an SSH brute force is cutting off the source, not quarantining the machine that held.
So the interesting number on that screen is not what the AI did. It is what it wanted to do and did not get.
This is what shadow mode is for. Set AI_SHADOW_MODE=1 and the defensive worker stops firing real actions. Anything it would have dispatched gets written into SOAR Hub > Shadow Queue as a proposal with shadow_status = pending, and an operator approves or rejects it. Proposals never expire and nothing decides for you. Turning on autonomy before watching what the model actually says yes to on production traffic means shipping an untested control against your own infrastructure.
To switch autonomy off entirely, set AI_AUTO_ACT_CONF=1.0 in .env.
8. What I took away from it
Detection layers should back each other up, not depend on each other. Even with the model proposing the wrong response, the alert had already come through the Sigma and pattern layers. The LLM sits on top of detection, not in place of it.
The most valuable screen in an EDR is the one admitting what it does not know. That “2 events the model could not answer on” banner is the most honest thing in the product.
Autonomous response gets measured in shadow mode first. The model asked for ISOLATE_HOST four times and the gate is the only reason it never got it. Autonomy switched on out of blind faith would have taken a production host out of service in a way the attacker never managed.
An EDR does not replace hardening. This box should already have had:
# /etc/ssh/sshd_config
PermitRootLogin no
PasswordAuthentication no      # keys only
PubkeyAuthentication yes
MaxAuthTries 3
AllowUsers <only-who-needs-it>
Plus an AWS security group restricting port 22 to my own address range, which would have kept this traffic out of auth.log entirely. An EDR tells you what happened. Shrinking the attack surface is still your job.
About Sentora
Sentora Community Edition is a self-hosted security stack for small and mid-sized teams without a dedicated SOC. Drop an agent on each endpoint, run one docker compose up, and you get SIEM logs, file integrity monitoring, package vulnerability scanning, an OpenSearch-backed log explorer, local LLM triage, and a SOAR playbook engine.
AGPL-3.0. Code, setup and architecture docs:
https://github.com/d3vhex/Sentora
Open issues, send PRs, break it. If you can get past the detection layers I would like to hear from you first.
Every screenshot here comes from a live deployment. The attacker addresses are unmasked because this was scan traffic aimed at a publicly reachable server. Sentora is AGPL-3.0: github.com/d3vhex/Sentora. Everything described above is on main, so pull before you file anything. If you want to break something, the agent listener is the interesting surface, and I would much rather hear about it from you than from an incident.